How-to · 4 min read ·
Five KPIs every SME dashboard needs
A good finance dashboard starts small. These five numbers tell most owners what they need to know, every morning.
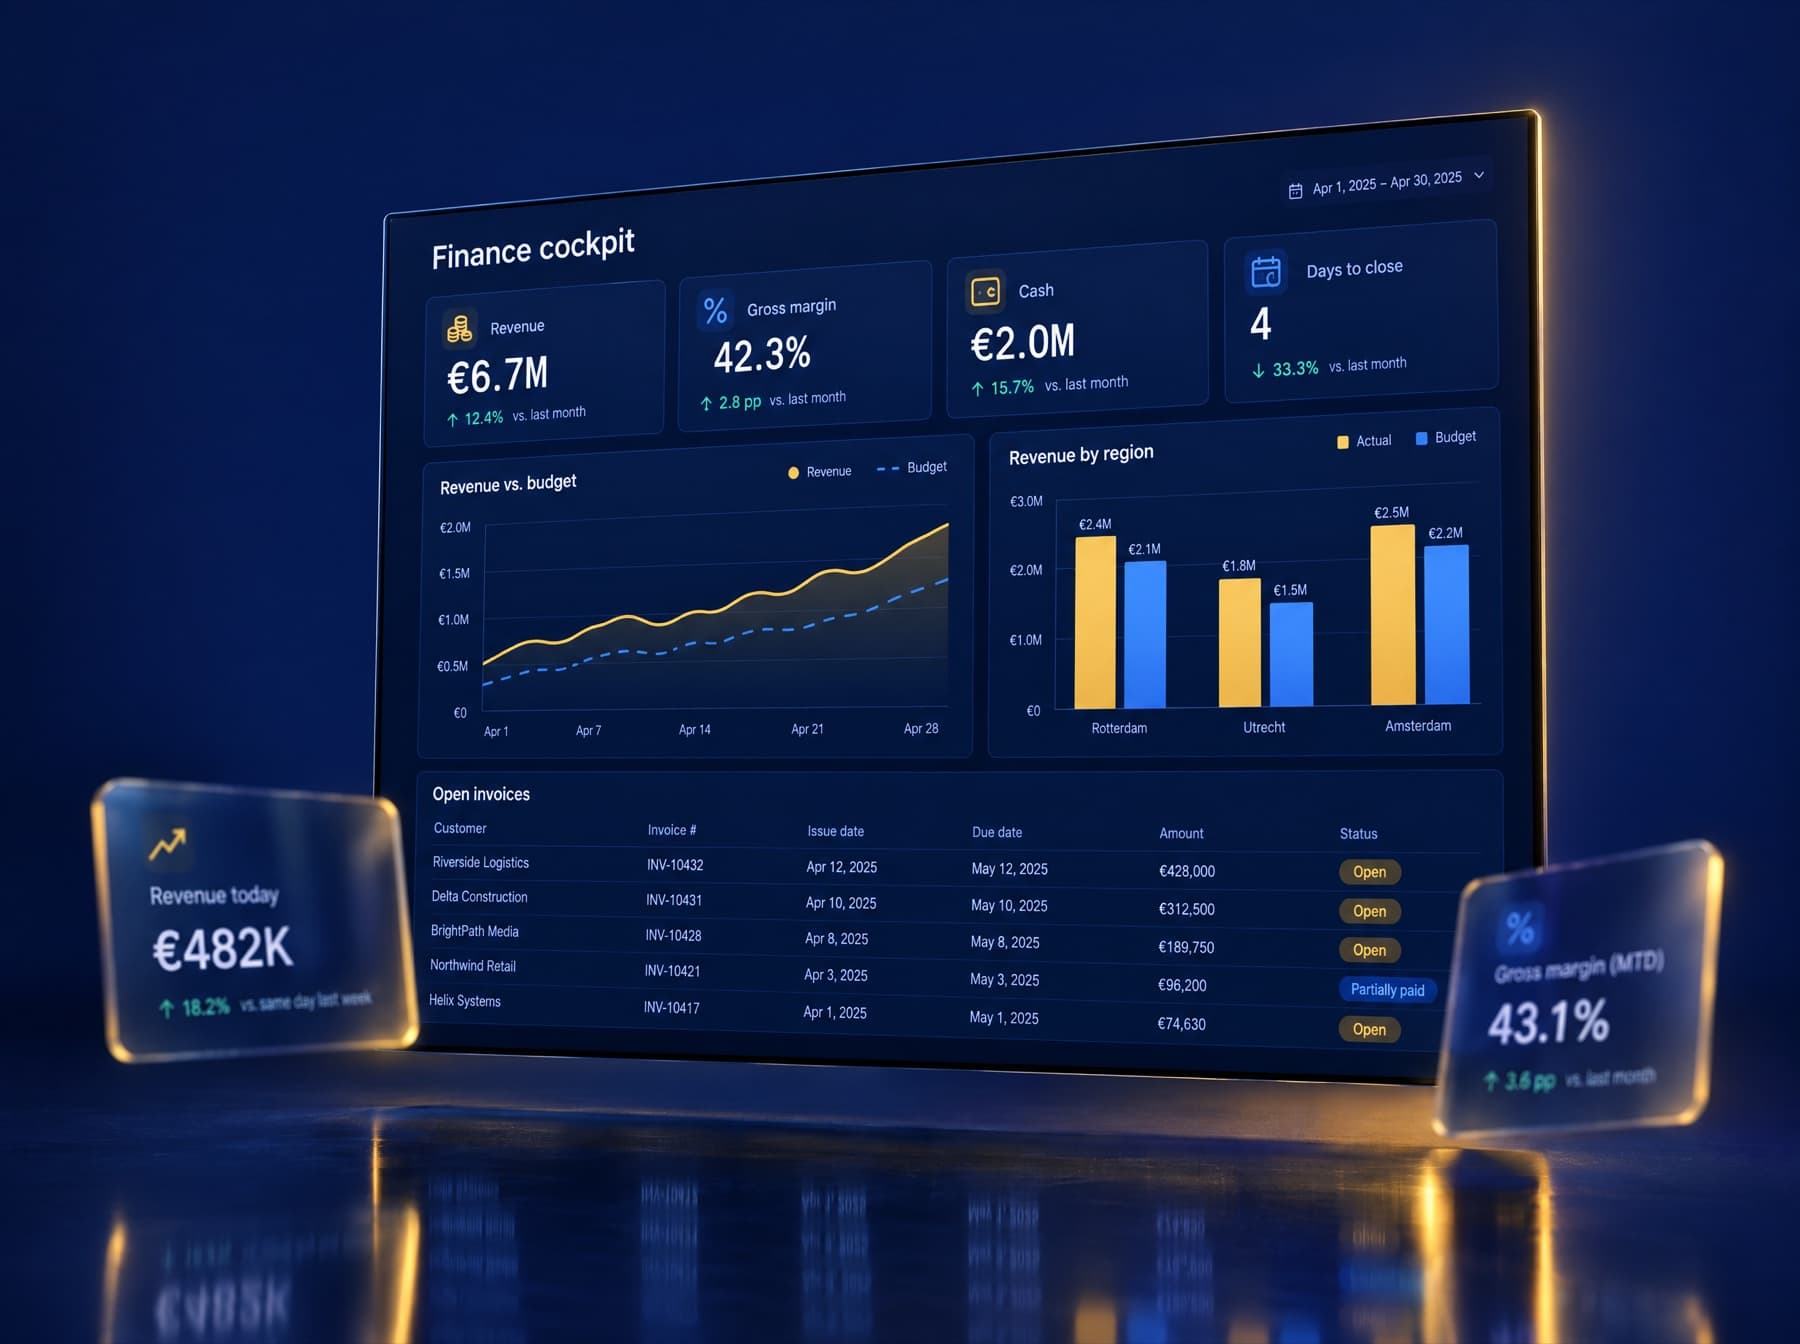
When companies ask us for a finance dashboard, the first draft of their wish list often has 40 metrics on it. The dashboards that actually get used start with five. Once those are trusted and checked daily, adding more is easy. Here are the five we almost always start with.
1. Cash position and 13-week forecast
Profit is an opinion, cash is a fact. Show today's bank balance across all accounts, plus a simple forecast of incoming and outgoing payments for the next 13 weeks. This one chart prevents more sleepless nights than anything else on the dashboard.
2. Revenue against target, per week
Monthly revenue arrives too late to act on. Weekly revenue, compared with the same week last year and with your target, shows trends while you can still do something about them. Split it by the one dimension that matters most to you: product group, region or sales rep.
3. Gross margin
Revenue growth means little if margin is sliding. Show gross margin as a percentage, per product group or service line. For many SMEs this is the number where the surprises live, especially after price increases from suppliers.
4. Debtors and days sales outstanding
How much are customers late, and who? A list of the ten largest overdue invoices, plus the trend in average days to get paid, turns credit control from a quarterly panic into a weekly routine.
5. One operational number
Finance does not live on its own. Pick one operational metric that drives your results: utilisation for a service business, order intake for a wholesaler, conversion rate for a web shop. Putting it next to the financial numbers connects the two conversations.
Make the definitions boring
The biggest reason dashboards fail is not technology but disagreement. Before building anything, write down exactly how each number is calculated:
- Which accounts and which cost centres are included
- Whether revenue is counted at order, delivery or invoice
- Which exchange rate or VAT treatment applies
- Who owns the definition and approves changes
Put these definitions in the dashboard itself, one click away from the chart.
Refresh daily, review weekly
A dashboard that updates once a month is just a prettier report. Connect it directly to your accounting package and bank so it refreshes every night. Then use it in a short weekly meeting, 15 minutes, same five numbers, same order.
Where to go from here
When the five are trusted, add depth: drill-downs per customer, budget versus actual per department, scenario forecasts. But resist the urge to start there. A small dashboard that everyone opens beats a big one that nobody trusts.
Next step
Want this for your business?
Tell us where you are now. We will tell you honestly whether we are the right fit.